

 Global consumer confidence edged up one index point to 98 in the first quarter of 2016, remaining relatively stable in the first quarter and slightly below the optimism baseline score of 100. The score reflects mixed confidence levels reported in every region, including some bright spots—particularly in the U.S., which showed resilience amid a fairly robust job market, and in the buoyant growth markets of India and Indonesia.
Europe is a good example of a region with country-by country variation: Confidence declined in 17 markets and rose in 11 in the first quarter. Both advanced and developing markets grappled with issues ranging from persistently high unemployment to geopolitical tensions, such as the refugee crisis and the Brexit debate—a U.K. referendum in June to remain within or leave the European Union. Similar variances in consumer confidence scores were seen in Asia-Pacific, where confidence declined in eight markets and rose in five. In Africa/Middle East, confidence declined in four markets and increased in two, and in North America, confidence rose in the U.S. but declined in Canada. In Latin America, confidence declined in six of seven measured markets.
“While the global consumer confidence index has been largely unchanged over the past several quarters, beneath that we see a fair amount of variation in the confidence of individual countries,” said Louise Keely, senior vice president, Nielsen, and president, The Demand Institute. “While 11 countries out of 61 saw their confidence increase five or more points relative to a year ago, 21 saw confidence fall five or more points compared to the first quarter of 2015. There is no one cause behind these rises and falls in confidence; the reasons are market-specific. In many oil-exporting countries, confidence is down relative to a year ago, as oil prices fell throughout 2015—even though oil prices have increased slightly in early 2016. At the same time, in some European markets such as Spain and Portugal, confidence is up markedly from a year ago, because unemployment rates have fallen and consumer price inflation has not yet picked up.”
In the latest online survey, conducted March 1-23, 2016, consumer confidence increased in 33% of the markets we measure (20 of 61 markets), compared with 43% of measured markets showing an increase in the fourth quarter of 2015. Among the world’s largest economies, the U.S. consumer confidence score was 110, remaining at or above the optimism baseline for nine consecutive quarters. Confidence levels declined from the previous quarter in China (105, -2pts), Germany (97, -1pt), the U.K. (97, -4pts) and Japan (73, -6pts).
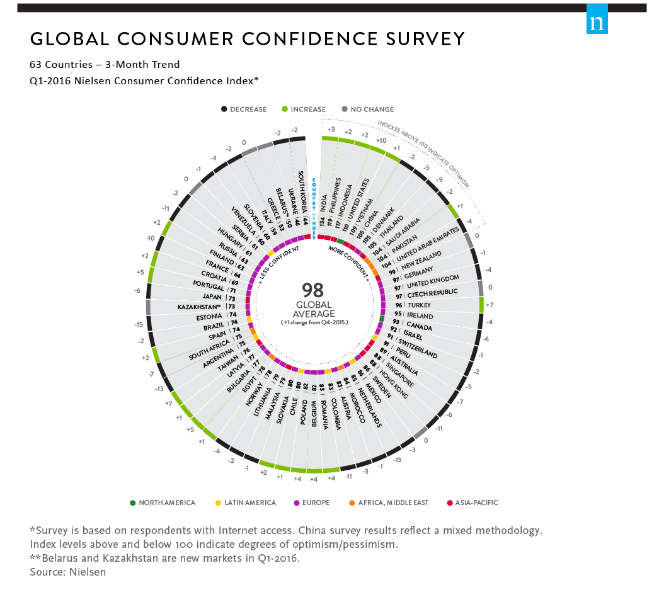
The Nielsen Consumer Confidence Index measures perceptions of local job prospects, personal finances and immediate spending intentions. Consumer confidence levels above and below a baseline of 100 indicate degrees of optimism and pessimism, respectively. The Nielsen Global Survey of Consumer Confidence and Spending Intentions, established in 2005, measures consumer confidence, major concerns and spending intentions among more than 30,000 respondents with Internet access in 63 countries. Belarus and Kazakhstan were added to the first-quarter survey.
Other findings include:
India and Indonesia stood out as buoyant growth markets in Asia, while confidence declined in Hong Kong and Japan.
U.S. consumer confidence showed resilience but also a rise in intent to pay down debts.
Six in 10 global respondents believed their nation’s economy was in recession in the first quarter, an increase from 55% in the fourth quarter of last year.
Chile was the only country measured in the Latin American region with a slight rise in confidence in the first quarter, up one point to 80 from the previous quarter.
Consumer confidence in all three sub-Saharan markets measured by Nielsen (Nigeria, Ghana and Kenya) were at high levels, but the latest results showed mixed trends.