 The failure rate of new products has always been high. However, in recent years, a number of nimble upstarts have emerged as fierce competitors to well-established category leaders. Their success has driven many large manufacturers to question whether their resources, scale and processes are weaknesses that should be discarded in favor of a new “agile” playbook emulating these emerging competitors.
However, it’s easy to forget that the most prominent new players represent a very small sample, and there are many others who failed to gain traction along the way. This results in “survivor bias” when assessing the performance of small players; because only the surviving brands are tracked, the average performance of small brands is artificially inflated.
Innovators tend to assume that small players are doing something right, and this “something” is a function of being small. Is it better targeting through digital media or streamlined pre-market testing protocols? Maybe it’s the ability to test and learn in-market because they rely less on traditional retailers? Setting aside the matter of whether these tactics are actually deliberate choices or the only available choice due to limited resources, large manufacturers have started to adopt these methods in pursuit of a new formula for success.
However, we must realize that questions like “What made Halo Top ice cream so successful?” and “How do we consistently launch more successful innovations?” don’t necessarily have the same answer. In fact, a sustainable and replicable formula for innovation success is more likely to come from scrutinizing the patterns revealed by post-mortem analyses of failed launches, which account for approximately 80%-85% of all fast-moving consumer goods (FMCG) launches, than from rare case studies of category disruptors.
Looking across thousands of product launches using Nielsen BASES’ rich database, we’ve observed three common causes of innovation failure that often don’t get the attention they deserve.

NEGLECTING TO ADDRESS A BROAD CONSUMER NEED
Approximately one half of innovations tested by Nielsen BASES don’t effectively articulate to consumers how they deliver on a broad consumer need. In some cases, such as when a new product is premium or targeted to a very specific audience, this is by design. Still, for a “niche” brand to have a chance of success, it must be incremental to the brand or to the category—ideally both.
Our preliminary research and development (R&D) suggest that only 5% of concepts that lack broad appeal will deliver above-average incrementality to the brand. In other words, launches considered niche are rarely incremental and could actually shrink the brand depending on how much support is misdirected to them.
FAILING TO PROVIDE A SATISFACTORY PRODUCT EXPERIENCE
Some manufacturers striving to be more “agile” are streamlining their product testing prior to launch, increasing the likelihood that consumers’ first experience with the new products will be suboptimal. In a recent Nielsen survey of more than 350 innovation professionals, 47% confessed that testing and refining the product experience tends to suffer most compared to other stages of the innovation process when speed to market is a priority.
Product experience is a key driver of repeat purchasing and long-term success. Brands often overestimate the loyalty of repeat buyers. A Nielsen study found that, on average, it takes approximately eight purchases for a consumer to become a truly loyal buyer. Between the trial purchase and the first repeat purchase, a brand will lose approximately half of its buyers. From the first repeat purchase to the second, the brand will again lose half of the remaining buyers. This cycle continues until it stabilizes—around the eight purchase. Without a strong product experience, brands won’t make it to that eight purchase, especially given the proliferation of new entrants, promotions and unavoidable variety-seeking.
According to a Nielsen BASES analysis, initiatives with strong performance in pre-market product testing are 15 times more likely to succeed in market than those with poor pre-market testing performance. Moreover, products that the BASES’ pre-market evaluation deems “not ready” on product-driven dimensions but launch anyway have an 80% failure rate in-market. The difference between a strong and a weak product experience can result in a sales difference of 30% in year one. Closing this gap through fast, efficient pre-market testing has considerable advantages over experimenting in-market.
PROVIDING INSUFFICIENT MARKETING SUPPORT
Another Nielsen study reviewing 600 product launches across multiple markets and categories found that one-third of the initiatives failed as a function of insufficient marketing support. Interestingly, an exceedingly strong product or proposition would’ve made little difference for these launches—they simply didn’t have the baseline marketing support needed to get the ball rolling.
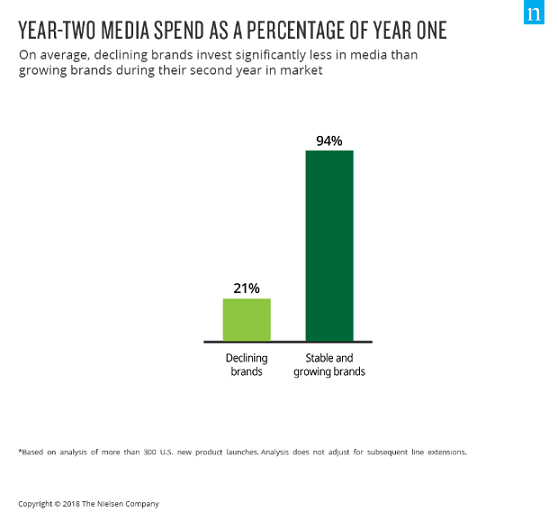
While sufficient marketing support in year one is crucial to get products launched, the challenges tend to stretch beyond year one. To remain competitive into year two, products cannot rely only on repeat customers—they also need a healthy influx of new triers. Because sustained trial demands a continued and growing awareness of the product, an investment in media is typically required to keep the product fresh in consumers’ minds. Despite this reality, budgets are often cut after year one, which erodes sales velocity. Eventually, this results in a loss of distribution and inevitable decline in years two and three. This chain reaction explains why two-thirds of new products decrease in volume during their second year in market.
Although these problems from insufficient marketing support become apparent after one or more years in market, they begin much earlier in the innovation planning stage. Based on a recent Nielsen analysis of 80 randomly-selected U.S. product launches across multiple categories, most of the variance between the initial forecasted sales estimates and the actual in-market performance could be explained by overly-optimistic marketing assumptions. The average volumetric difference between these two scenarios—planned vs. actual support—was approximately 30%. Regardless of client, country and category, many similar analyses we’ve conducted over the years tell the same story: there’s a consistent bias towards significantly overstating the anticipated level of marketing support.
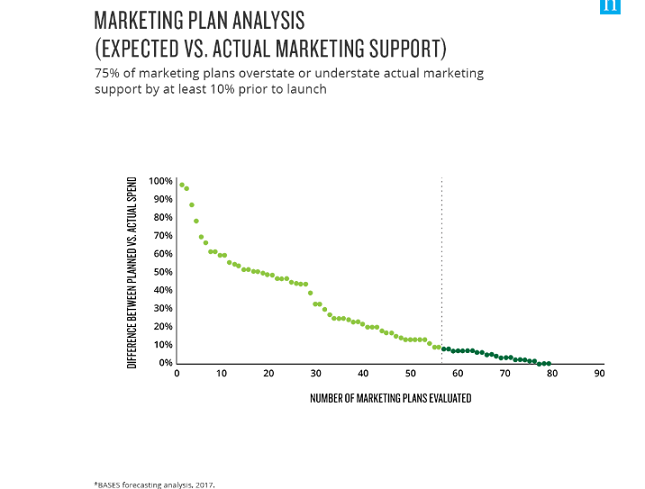
One could argue that it’s impossible to predict accurately what will happen when a product finally launches; innovation cycles can take months or even years, during which time both internal budgets and the marketplace can shift considerably. Over the past few years, Nielsen BASES forecasting teams have partnered with select clients to improve the accuracy of marketing assumptions, reducing the variance created by faulty assumptions from 30% to 5%. These teams leverage category benchmarks, past execution history, and known best practices to make considerably more accurate predictions of expected levels of support. Though it requires effort, skill and access to the right information, we know that predicting accurate marketing inputs in advance can be done.
While new methods, interfaces and frameworks can be valuable, they’re no substitute for addressing the fundamental challenges above that continue to plague many manufacturers. The principles driving innovation success remain relatively simple on the surface:
Invest in a good idea.
Transform it into a fantastic product that delivers on the promise.
Effectively support the brand in year one so it has a chance to compete.
Have the patience to drive enough penetration to build sustainable volume.
Maintain organizational focus on only those innovations that will drive overall brand growth.
The easiest path to the first page of search results, positive social media mentions, and a five-star rating is to offer a fantastic product experience that delights consumers.
Authored By Kamal Malek, SVP of Data Science, Nielsen BASES, and Ramon Melgarejo, SVP of Product Leadership, Nielsen BASES