 Erosion of linear TV viewing stalls adspend growth, as addressable TV sees slow take-up
Linear TV, inclusive of real time and catch up viewing, remains by far the top medium for global display advertising spend, attracting over $140bn ad investment in 2018 – more than double mobile internet in second place on $58bn.
Linear TV’s core strength is reach, and whilst daily viewing time has fallen worldwide in recent years – coinciding with the steady rise in internet penetration – advertiser demand has not diminished.
As the industry looks ahead, despite the challenges, addressable TV – the ability to show different ads to different households based on consumer data – may be where future growth lies.
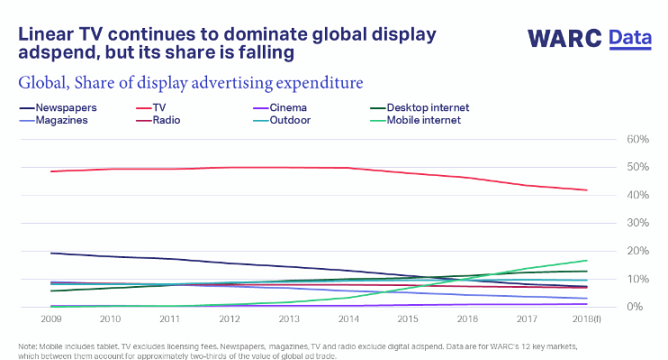
TV continues to dominate global display adspend but its share is falling
Linear TV is estimated to have accounted for 41.9% of the total display advertising investment this year, or $140bn, in WARC’s 12 key markets -Australia, Brazil, Canada, China, France, Germany, India, Italy, Japan, Russia, UK and US. This represents a rise in spend of 1.0% from 2017 and a share 25.1 percentage points (pp) ahead of the second-largest display medium, mobile internet.
However, linear TV’s dominating position has been eroding since 2009, mostly at the expense of mobile, which has grown 16.6pp since then.
TV’s reach is unparalleled, making it high in demand from advertisers despite viewing times decreasing
TV’s core strength is reach, and its function to facilitate top-of-funnel building, which it does far more effectively than other media, especially over the long-term. Data collated by The Global TV Group from national monitoring organisations show that TV reaches 96% of individuals in key markets each month, and 71% each day on average.
But daily time spent viewing linear TV has fallen worldwide in recent years – it registered one hour 54 minutes during the first half of 2018, down four minutes from 2017 and 21 minutes from 2012 – coinciding with a steady rise in internet penetration.
The decline in linear viewing has not, however, led to a reduction in advertiser demand. This has driven up spot cost-per-thousand (CPM) in all key markets this year, ranging from rises of 14% in India, 4% in the US, 2% in the UK to 1% in Japan.
TV takes almost two-thirds of brands’ successful, high-budget campaigns
WARC’s Media Allocation Report, which draws from campaign data from over 15,000 case studies, shows that successful, high-budget campaigns invest more in TV while the proportion of budget allocated to digital decreases. Globally, successful brands in the alcoholic drinks and financial services sectors are the biggest spenders on TV.
In the UK, research has shown that, in the long-term (over three years), TV advertising is responsible for 71% of total ad-generated profit and in the short-term (three to six months), TV ads are responsible for 62%. In both cases, TV accounts for the largest share of profit when compared to other media.
TV’s effectiveness is undervalued
Despite research by the Advertising Research Foundation (ARF) showing that sales returns dip $3 for every $1 reduction in TV advertising, and data from Ebiquity showing that TV ranks as the #1 most effective ad medium, 32% of brands responding to WARC’s recent Marketer’s Toolkit survey stated they intend to cut TV investment in 2019. Just under half (49%) intend to retain current levels of investment, while only 18% plan to increase TV spend.
Addressable TV will bring new challenges to the planning process
Smart and connected TV penetration reached 35.2% worldwide in 2018, paving the way for forays into addressable TV.
Whilst still in its infancy, addressable TV technology gives advertisers the ability to leverage user data to combine TV’s reach with an expanded relationship to sales and lower-funnel KPIs.
But research shows that US viewers are largely unwilling for their personal data to be collected to facilitate such advertisements. Other concerns include measuring addressable TV’s ROI accurately, and brands will need to weigh the benefits of its efficiency and frequency against increased media and creative costs.
James McDonald, Data Editor, WARC, summing up, says: “TV is a stalwart of the advertising industry, used to deliver effective brand building campaigns with positive ROI to a mass, engaged audience.
Addressable TV will be the next stage of evolution, though the $1bn spent worldwide this year is a fraction of total TV investment. As live TV still accounts for the majority of daily video consumption, the lure for advertisers is leveraging consumer data to get the right message in front of the right people at the right time.”
Global media analysis: A round-up of TV
10.0% addressable share of TV ad impacts by 2022
41.9% TV’s share of global display advertising spend
56.4% live TV’s share of total daily video viewing in the UK
61.5% US consumers unwilling to have their personal data collected for more relevant TV advertising
62.0% TV’s allocation in successful high-budget (10m+) campaigns
71.0% proportion of long-term advertising-generated profit by TV