 Warc releases its latest Global Ad Trends report
Warc, the marketing intelligence service, has today released its latest Global Ad Trends report, a unique and illuminating analysis of the data recorded in Warc’s survey of global advertising expenditure, to reveal the underlying global advertising and media investment trends and provide an outlook for the future.
Warc’s survey of adspend has run annually since 1980 and involves input from partners in 96 reporting markets. The Global Ad Trends report, published today, is now in its third edition.
James McDonald, Warc’s senior data analyst and author of the research, said: “Our extensive research provides a comprehensive overview of the marketing communications industry spanning over 30 years and our unique methodology allows us to measure the impact of currency fluctuations on advertising investment at a local and global level.”
Key findings of Warc’s research between 2006-2015 reveal:
The strengthening of the US dollar removed $44.8bn from the value of the global ad market in 2015.
The opposite was true for the euro ad trade; €37.3bn of global growth was superficial due to the currency’s devaluation.
Inflation-adjusted Purchasing Power Parity (PPPs) show that in 2015, the value of global ad transactions finally reached parity with the peak preceding the global financial crisis – an eight-year recovery.
The value of the US ad market remained unchanged in the decade between 2006 and 2015. The value of China’s market grew 3.5 times during this period.
Hong Kong spends the most per capita on advertising (US$782.33). The USA follows (US$523.74) with Australia in third (US$467.18).
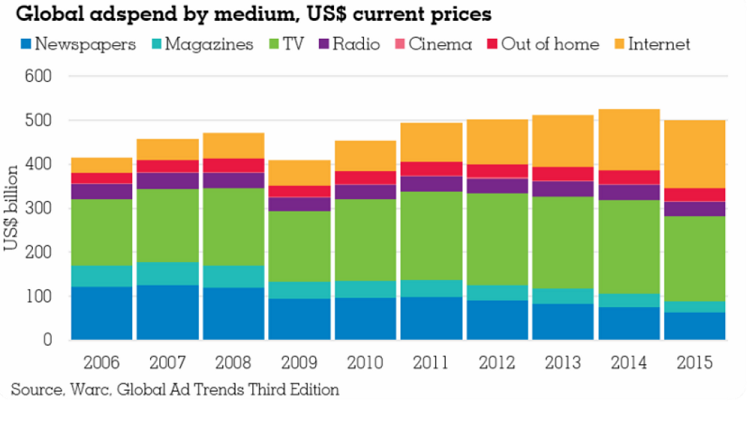
The US$155bn spent securing ad space online in 2015 was 3.5 times greater than a decade earlier, equating to a Compound Annual Growth Rate (CAGR) of 18.1%
Of the internet spend, almost two-thirds (30.7%) was for mobile ads, up from a share of just 1% from 2006.
TV was still the largest ad medium by spend in 2015 – at US$195bn – though a strong dollar removed US$17.8bn from global TV ad revenues.
TV’s share of global adspend has fallen each year between 2012 and 2015, with the 1.6 percentage point loss in 2015 representing the largest decline on record.
Only eight of the 96 markets monitored recorded growth in magazine ad revenue in 2015.
Commenting on these findings, McDonald says: “Chief among these findings is the revelation that, by the purest measure available, the combined value of ad trade worldwide took a full eight years to recover from the global financial crisis.”

“It is also fascinating to note the juxtaposed trajectories of the world’s two largest advertising markets. While the amount spent to secure ad space in the US remained unchanged during the ten years to 2015, that spent in China grew three and a half times over this period.”
Reviewing the Global roundup for 2016 and outlook for 2017, Warc estimates that:
Global adspend rose 5.2% in 2016, and anticipates growth of 3.6% in 2017.
Eight of Warc’s 12 key markets (which account for two-thirds of global adspend) are expected to witness a slowdown in adspend growth next year.
Worldwide internet adspend is expected to rise 12.5% in 2017, compared to a 1.9% decline for TV.
Mobile is thought to have become the largest ad platform in China this year – the first of the 96 monitored markets to witness this.
Mobile is set to become the second-largest ad channel in the US next year, with some US$40bn expected to be spent reaching consumers on their phones.
Approximately one in four pounds spent on UK advertising today goes to search providers.
“In a real sign of the times, we believe that in 2016 China became the first market in which mobile was the biggest advertising channel by spend,” comments McDonald.


